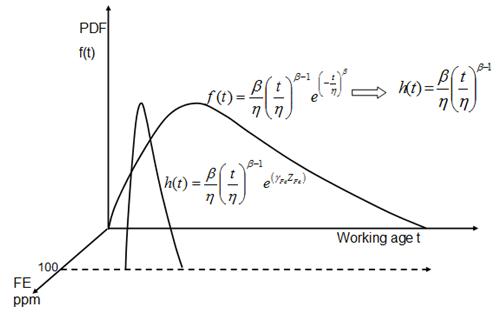
The difference is that Weibull is a reliability analysis procedure in two dimensions, namely Reliability versus Age. Its main purpose is to discover the relationship (equation) relating reliability and age.
EXAKT is a reliability analysis software that relates several dimensions, namely Reliability versus Age versus each monitoring variable (condition indicator) discovered in the analysis procedure to influence Reliability.
In the two dimensional (back) plane of the graph of the Figure, the reliability (in the form of probability density) is plotted against age. (The corresponding failure rate h(t) form of the model is also shown.) The result is a wide probability distribution as is commonly seen in maintenance. Next we introduce a third dimension, Iron, for example. Assume that a high value of Iron (Fe), say 100 ppm, dissolved in the lubrication oil of a bearing or engine, is closely related to the item’s (conditional) failure probability. If we were to re-plot the probability density curve, but only for those life cycles whose endings are preceded by CBM values for Iron greater than, say, 100 ppm, we would get the narrow, low scatter, “confident” predictive distribution illustrated in the foreground of the Figure. The less influential that Iron is to failure probability the wider will be our probability distribution, imparting lower confidence to our CBM decisions.
When performing two-dimensional analysis in maintenance the Reliability Engineer doesn’t have to worry about the quality of the data sample because the results are so general as to be, often, useless for failure prediction. That is because the Age dimension is a mixture. Age comprises all the unaccounted for yet failure influential variables. Since those hidden variables are not monitored explicitly in a CBM process, they have no way to exert their influence on the model except through the age dimension. Consider an example where the accumulated damage to a bearing is highly related to the number of times that it has been subjected to excessive stress due to some overload condition. Yet these incidences will not have been recorded or if they have been recorded, say in the DCS, assume that they may have have been ignored as condition indicators. Then the reliability (PHM) equation derived from the records of failure incidences and from the less influential monitored variables (say weekly vibration and monthly oil analysis) will exhibit a higher shape factor than it would if the historical values of the more significant variable were also included in the analysis.
If the analysis is simple Weibull, the significant factors influencing a specific failure mode are further diluted in the age dimension of the model causing high scatter (a high standard deviation – a widely spread out probability density curve). That is to say, the confidence in decisions derived from the two-dimensional model will be low, age being the sole decision criterion. There is little that can be done to improve the two-dimensional model’s inadequate predictive capability because age alone is usually too general a decision determining factor.
EXAKT, as opposed to simple Weibull, requires good failure mode, failure, and suspension discrimination in the work order reporting system because its results are intended to provide practical, unambiguous decision support on a day-to-day basis. The results of decisions made from the EXAKT model are measurable through the LRCM process. LRCM requires that the PF (potential failure) detected by the CBM model be confirmed or refuted upon execution of the work resulting from the model’s recommendation. The model can assess its own performance based on that as-found (i.e. Event Type = PF, FF, or S) work order information. The model is periodically upgraded as more events and better reporting procedures (as specified by LRCM) generate accurate linking between work orders and RCM knowledge (i.e. failure mode) records.
In general, age-based maintenance decision models tend to produce more conservative maintenance policies than those produced by condition-based models. Conservatism in preventive maintenance translates to greater unnecessary loss of useful life. An optimized CBM decision model, by detecting potential failures in a timely fashion, will tend to maximize equipment useful life.
© 2011 – 2014, Murray Wiseman. All rights reserved.

