Cost and availability combined
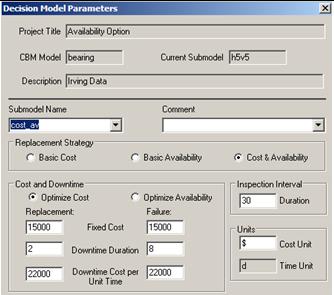
The parameters of this economic strategy formulation are:
- The fixed costs of preventive and failure replacement (maintenance),
- The fixed downtimes due to preventive and failure replacements, and
- The costs per unit time of downtimes (which may be different for preventive and failure replacements).
A reasonable way to formulate the total costs of reactive and preventive maintenance would be:
The combined cost and availabiltiy optimization option is used to minimize expected cost per unit time taking into account costs and duration of preventive and failure downtimes, and cost of downtime.
The software finds the CBM and age control limits that, if acted upon consistently by the maintenance department, will result in highest profitability accounting for the costs of lost production and maintenance cost penalties due failure. The optimal decision model is found by minimizing the combined cost function:
Where:
Cp, Cf are the fixed costs of failure and preventive actions,
tp, tf are the down times of failure and preventive actions,
ap, af are the hourly maintenance and lost production costs associated with failure and prevention.
This cost model allows for flexibility in setting up realistic parameters upon which to build the optimal decision model. For example,
- the fixed cost of failure replacement may be high (say due to the cost of a new part), but
- the downtime required may be short (just to replace the part)
Or, by comparison, the situation may be that:
- the cost of preventive work can be small, but
- the time to complete the work (downtime) can be long.
This option resolves the difficult problem of deciding upon maintenance policies in the light of actual maintenance costs.
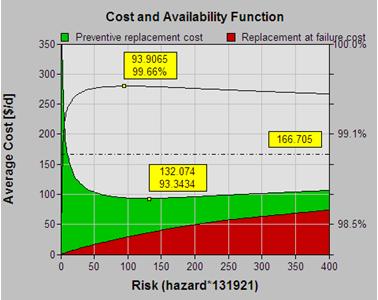
The generalized cost and availability optimization model is described by a slightly more complex graph and table shown in the slide.
| Table 3 |
|---|
 |
Some of the column headings now refer to both cost and availability, so that we can see, precisely, the results of applying the optimal CBM policy. In this example, the optimal expected results are:
- Cost: 93 $/d (73% better than running to failure)
- Availabilty 99% (35% better than running to failure)
- Average running time between interventions: 866 days (280 days worse than the RTF policy)
In the final analysis optimization addresses cost. The cost and availability model, permit us to consider the factors affecting cost and availability, separately. The optimization normalizes both sets of factors to ultimate cost. The best (lowest ultimate bottom line cost) is attained by the decision modeling and deployment process. The feature encourages maintenance engineers and managers to elicit and consider cost information about failure and normal operational costs because they can now use it effectively in their decision process.
© 2011 – 2015, Murray Wiseman. All rights reserved.


[…] that will enable the maintenance engineer to arrive at a general policy. The article “CBM Optimization” describes the analysis […]
[…] The entire exercise above, onerous as it appears, can be executed in less than ten minutes, once you gain some familiarity with the user interface. The mechanics of using the EXAKT program are, in actuality, the easiest part of the CBM decision modeling process. The more difficult part of the process begins with the maintenance work order. Specifically, the work order form wherein the technician enters the right data. The true challenge lies in understanding the nature of data. The type and quality of data required for the above analysis is explained in the article CBM Optimization. […]
[…] such as EXAKT, see https://www.livingreliability.com/en/posts/cbm-optimization/ […]